After a drop, wait for the turn, not the bottom.
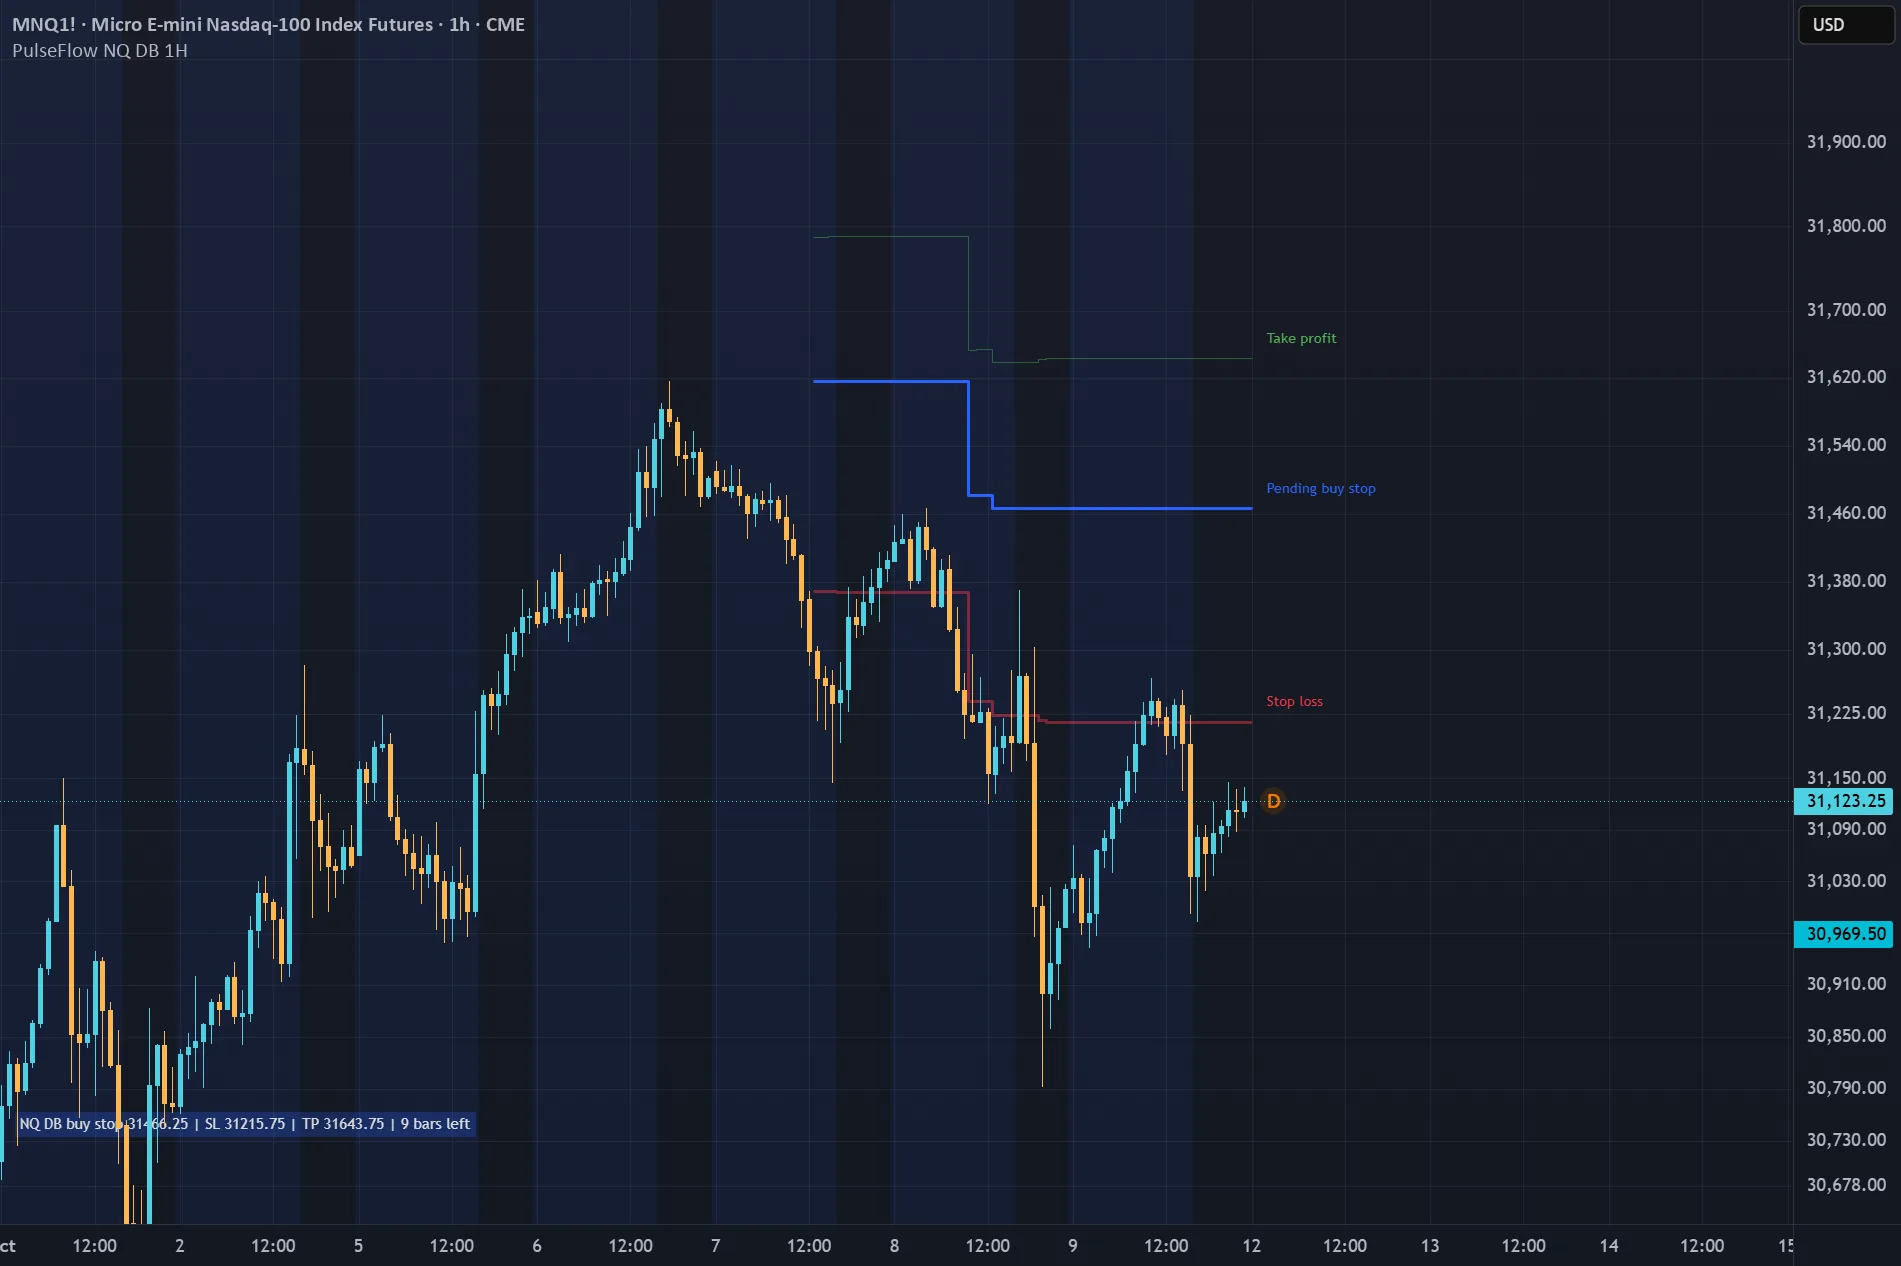
PulseFlow Nasdaq Dip Breakout 1H is a TradingView indicator for Nasdaq 100 futures (NQ1! or MNQ1!) on the 1-hour chart. It waits for a decline, then draws a buy-stop plan: the order only triggers if price turns back up through a recent high. Every plan shows its stop loss and take profit before the trade exists. Long only.
Too early is expensive
A falling market looks cheap on every candle. Buy too soon and the first level price reaches is your stop. Here the plan waits until price proves the turn by climbing back above a recent high.
The plan, drawn before the trade
A blue line marks the pending buy stop. A red line marks the stop loss: faint while the order waits, solid once the trade is open, and it only moves up as the trailing stop follows price. A green line marks the take profit. Each line carries its name, and labels mark every entry and exit (TP, SL or Trail) with its price. This way you do not have to improvise once the market is already moving.
Always know where you stand
A one-line panel at the bottom left shows the current state: a pending order with its levels and bars left, an open trade, or no order yet. One alert per bar close tells you when to place, move or cancel the buy stop, when it fills, when to move the stop and when the trade exits.
Keep in mind
Use NQ1! or MNQ1! on a 1-hour chart with back-adjustment (B-ADJ) on; on other timeframes it draws nothing and says so in the panel. The indicator decides at bar close, so a live order can fill at a different price. The lines are a plan, not executed trades.
Let the market turn first. The decision stays yours.
View on TradingView ↗PulseFlow Nasdaq Dip Breakout 1H is a TradingView indicator for Nasdaq 100 futures (NQ1! or MNQ1!) on the 1-hour chart. It waits for a decline, then draws a buy-stop plan: the order only triggers if price turns back up through a recent high. Every plan shows its stop loss and take profit before the trade exists. Long only.
Too early is expensive
A falling market looks cheap on every candle. Buy too soon and the first level price reaches is your stop. Here the plan waits until price proves the turn by climbing back above a recent high.
The plan, drawn before the trade
A blue line marks the pending buy stop. A red line marks the stop loss: faint while the order waits, solid once the trade is open, and it only moves up as the trailing stop follows price. A green line marks the take profit. Each line carries its name, and labels mark every entry and exit (TP, SL or Trail) with its price. This way you do not have to improvise once the market is already moving.
Always know where you stand
A one-line panel at the bottom left shows the current state: a pending order with its levels and bars left, an open trade, or no order yet. One alert per bar close tells you when to place, move or cancel the buy stop, when it fills, when to move the stop and when the trade exits.
Keep in mind
Use NQ1! or MNQ1! on a 1-hour chart with back-adjustment (B-ADJ) on; on other timeframes it draws nothing and says so in the panel. The indicator decides at bar close, so a live order can fill at a different price. The lines are a plan, not executed trades.
Let the market turn first. The decision stays yours.
Price
Prices are not active because of TradingView's new rule, which takes effect on 1 November. Create your account and tick "Notify me": we will email you when they are.
Notify me