Let the crowd chase the breakout. Be waiting where it gets trapped.
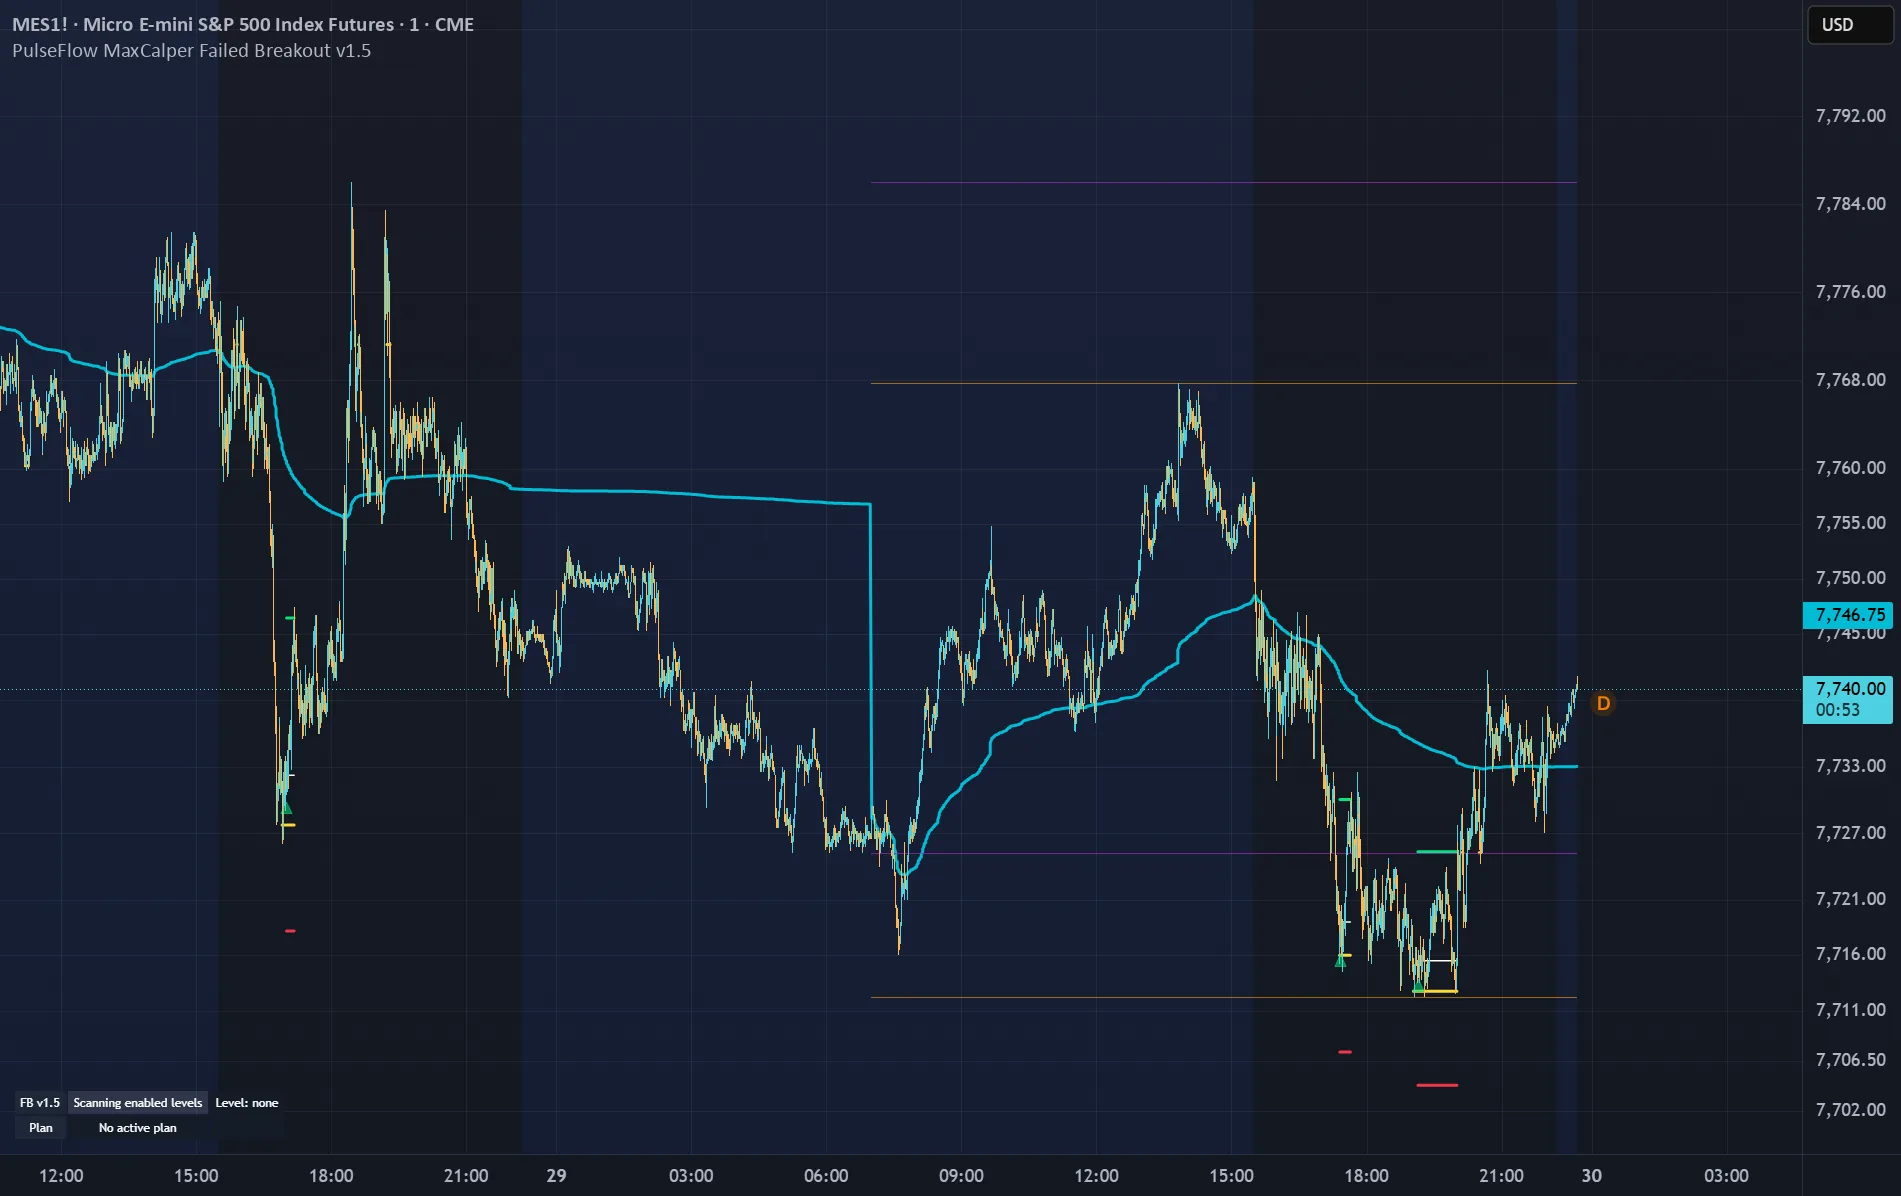
PulseFlow MaxCalper Failed Breakout is a TradingView indicator for scalpers on standard 1 to 4 minute candles. It marks the moment a session high or low breaks, the move fails and price comes back inside the range, then draws a reference plan.
The scene
Price pushes through the high of the day and everyone feels the same pull: now or never. Breakout traders pile in. Then the move stalls, price slips back under the level and those who chased may be on the wrong side. You can wait, calm, with a plan on screen.
What you see
The high and low of the current and previous session, drawn only for the latest day so the chart stays clean, plus the session VWAP. When a failed breakout is confirmed at the candle close, a small translucent triangle appears: green below the candle for longs, red above for shorts.
Fewer marks, a plan already drawn
Not every breach counts. The indicator marks only a few, so you can put your attention on them and read them calmly. For the latest mark you see the recovered level, an entry reference, a stop beyond the failed move and a target toward the nearest obstacle, with reward / risk. No scrambling for numbers mid-move; the call stays yours. If a stop is swept and price turns back again, a second entry can be marked in the same direction.
Calm, on the left
A compact two-row panel shows the current state and the active plan; hover it for session, volume context and the last event. Two alerts, confirmed long and confirmed short, let you step away.
Keep in mind
Made for liquid instruments with reliable volume data. Signals and plans use closed candles only, and the plan is visual: no fills, spread, slippage or commissions are simulated. Buying and selling pressure is inferred from price and volume, not from the order book or identified traders. A failed breakout can still turn into a real breakout.
Let them chase. You bring the plan.
View on TradingView ↗PulseFlow MaxCalper Failed Breakout is a TradingView indicator for scalpers on standard 1 to 4 minute candles. It marks the moment a session high or low breaks, the move fails and price comes back inside the range, then draws a reference plan.
The scene
Price pushes through the high of the day and everyone feels the same pull: now or never. Breakout traders pile in. Then the move stalls, price slips back under the level and those who chased may be on the wrong side. You can wait, calm, with a plan on screen.
What you see
The high and low of the current and previous session, drawn only for the latest day so the chart stays clean, plus the session VWAP. When a failed breakout is confirmed at the candle close, a small translucent triangle appears: green below the candle for longs, red above for shorts.
Fewer marks, a plan already drawn
Not every breach counts. The indicator marks only a few, so you can put your attention on them and read them calmly. For the latest mark you see the recovered level, an entry reference, a stop beyond the failed move and a target toward the nearest obstacle, with reward / risk. No scrambling for numbers mid-move; the call stays yours. If a stop is swept and price turns back again, a second entry can be marked in the same direction.
Calm, on the left
A compact two-row panel shows the current state and the active plan; hover it for session, volume context and the last event. Two alerts, confirmed long and confirmed short, let you step away.
Keep in mind
Made for liquid instruments with reliable volume data. Signals and plans use closed candles only, and the plan is visual: no fills, spread, slippage or commissions are simulated. Buying and selling pressure is inferred from price and volume, not from the order book or identified traders. A failed breakout can still turn into a real breakout.
Let them chase. You bring the plan.
Price
Prices are not active because of TradingView's new rule, which takes effect on 1 November. Create your account and tick "Notify me": we will email you when they are.
Notify me