Your year, mapped before it unfolds.
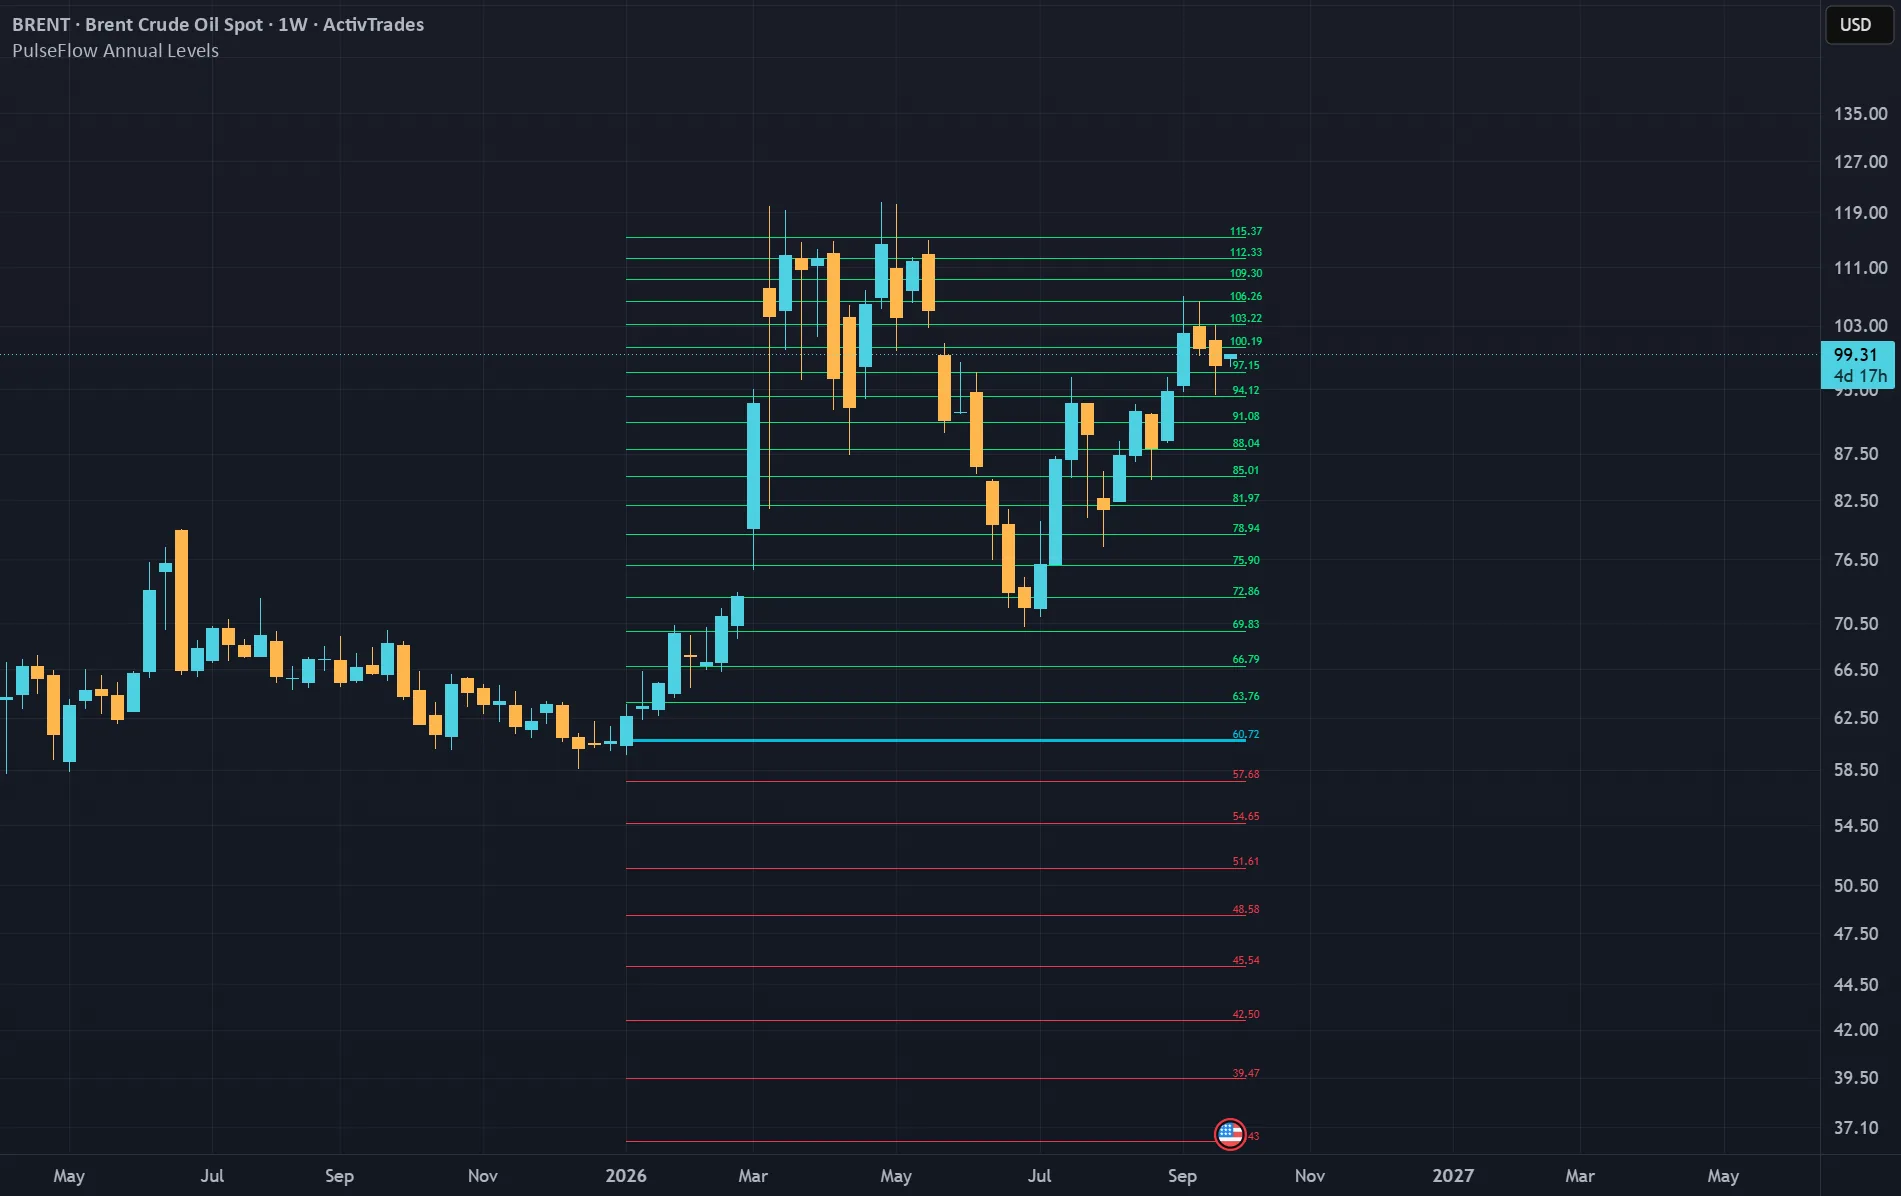
Annual Percentage Levels ±90% is an indicator that draws the percentage targets institutional traders use for the year, measured from its opening price. That keeps them in view on your chart.
The method behind it
Funds, banks and trading desks plan and measure their trades in percentages from the opening price of the year, the week and the day. Those distances are their targets: where they take profits, close or adjust positions and manage risk. That is why many traders keep an eye on these percentage levels.
Simple to read
The opening price is the first price of the year. A percentage level is a line set a fixed distance from it: +10% sits ten percent above, -10% ten percent below. Your 0% line is the annual open, in aqua. Around it runs a ladder from -90% to +90% in 5% steps, green above, red below, each line with its price label.
Picture your year
It is spring. Price climbs toward a green +15% line that has waited there since the year opened. You are not chasing and you are not guessing. You watch what price does at a level where institutional targets sit: stall, turn or run through. Calm, with the whole year in view.
Built for the long view
The current year extends with every new bar. When a new one begins, the finished year stays separate and its lines stop at its last bar. Keep or hide past years, choose how many, and set the interval between levels, the maximum positive and negative deviation and the line width. Made for investors and position traders, and useful to swing traders too. The levels are references, not automatic entries or exits.
It is not magic. It is institutional behavior.
View on TradingView ↗Annual Percentage Levels ±90% is an indicator that draws the percentage targets institutional traders use for the year, measured from its opening price. That keeps them in view on your chart.
The method behind it
Funds, banks and trading desks plan and measure their trades in percentages from the opening price of the year, the week and the day. Those distances are their targets: where they take profits, close or adjust positions and manage risk. That is why many traders keep an eye on these percentage levels.
Simple to read
The opening price is the first price of the year. A percentage level is a line set a fixed distance from it: +10% sits ten percent above, -10% ten percent below. Your 0% line is the annual open, in aqua. Around it runs a ladder from -90% to +90% in 5% steps, green above, red below, each line with its price label.
Picture your year
It is spring. Price climbs toward a green +15% line that has waited there since the year opened. You are not chasing and you are not guessing. You watch what price does at a level where institutional targets sit: stall, turn or run through. Calm, with the whole year in view.
Built for the long view
The current year extends with every new bar. When a new one begins, the finished year stays separate and its lines stop at its last bar. Keep or hide past years, choose how many, and set the interval between levels, the maximum positive and negative deviation and the line width. Made for investors and position traders, and useful to swing traders too. The levels are references, not automatic entries or exits.
It is not magic. It is institutional behavior.
Price
Prices are not active because of TradingView's new rule, which takes effect on 1 November. Create your account and tick "Notify me": we will email you when they are.
Notify me